The Challenge: The "Sea of Red" in Wireshark
When enterprise users complain that "the application is slow," network engineers and DevOps teams are caught in a stressful blame game. To find the root cause, someone has to pull a massive PCAPNG from the core switch and manually comb through the traffic.
What they find is usually an overwhelming "sea of red" — thousands of TCP Retransmissions, Duplicate ACKs, and Spurious Retransmissions. Proving whether that's caused by a physical link drop, a congested switch buffer, or an overloaded application server is a manual, error-prone process that can devastate your MTTR while the outage continues.
Applying tcp.analysis.retransmission only tells you that packets are dropping, not why. Engineers are left guessing whether the cause is an MTU mismatch, asymmetric routing, or a saturated uplink.
Proving a specific latency bottleneck requires manually plotting tcptrace I/O graphs, calculating average Round Trip Times (RTT) across streams, and comparing sequence and acknowledgment numbers by hand.
"Users blamed the network for consistent database timeouts during peak hours. Wireshark showed a 40% retransmission rate, but graphing the TCP sequence numbers to prove it was actually a server-side TCP Zero Window issue took me half the day."
— Senior Network Engineer, SaaS Company
The Solution: Automated Performance Diagnostics
PcapAI eliminates manual TCP stream tracking and tedious graphing entirely. Upload your capture and our deep packet inspection engine instantly calculates global performance metrics, profiles transport-layer anomalies, and isolates the specific endpoints responsible for the congestion. Hours of network forensics become an instantaneous diagnostic report.
-
✦
Global Retransmission Scoring: instantly calculates global and per-endpoint packet loss rates, highlighting critical failures like a 15.4% retransmission rate isolated to a specific database VLAN (e.g.,
10.0.50.0/24). - ✦ Network vs. Application Latency: automatically differentiates between slow physical links with high RTT (>200ms) and overloaded server applications triggering TCP Zero Window or Window Full events — so you know exactly who to call.
- ✦ Microburst & Buffer Exhaustion Detection: identifies millisecond-level throughput spikes that silently overwhelm top-of-rack switch buffers — causing massive packet drops invisible to standard SNMP monitoring.
- ✦ Clear Forensic Evidence: generates a boardroom-ready PDF proving exactly why the application is slow — ending the finger-pointing loop between DevOps, NetOps, and external vendors.
Wireshark Manual Analysis vs. PcapAI
Manual (Wireshark) — 1.5GB PCAP
Configuring tcp.analysis filters across multiple streams, exporting tcptrace graphs to external tools, and manually calculating RTT averages. Process takes 1–3 hours.
PcapAI — 1.5GB PCAP
Automated throughput profiling, connection latency separation, and precise retransmission calculation per flow. Process takes under 20 seconds.
How It Works
Upload Your PCAP
Drop any .pcap or .pcapng file — captured from a firewall, switch SPAN port, or any network tap. No installation required.
AI Profiles Every TCP Flow
Our engine calculates RTT, retransmission rates, window sizes, and Zero Window events across every connection — not just the top 10.
Know Exactly What to Fix
Get a ranked list of the worst-performing endpoints, root cause classification, and a PDF report you can hand to your vendor or management.
Frequently Asked Questions
How do you find TCP retransmissions in Wireshark?
The standard approach is the display filter tcp.analysis.retransmission or tcp.analysis.fast_retransmission. This highlights individual dropped packets but doesn't calculate the overall retransmission rate or tell you which endpoint is responsible. PcapAI analyzes every flow in bulk, calculates per-endpoint loss percentages, and points directly to the offending IP pair — without any manual filtering.
What causes a TCP retransmission storm?
A TCP retransmission storm occurs when a significant percentage of packets are dropped in transit, forcing the sender to repeatedly retransmit. Common root causes include congested top-of-rack switch buffers, faulty Ethernet cabling, duplex mismatches between interfaces, or an overloaded stateful firewall dropping active connections. Microbursts — sudden traffic spikes lasting just milliseconds — are a particularly common and hard-to-spot cause that standard SNMP monitoring completely misses.
What is a TCP Zero Window and why does it cause slowness?
A TCP Zero Window event occurs when a receiving host advertises a receive window size of zero, signaling to the sender that its buffer is full and it cannot accept more data. This effectively pauses the connection until the receiver processes its backlog. Zero Window events are a server-side problem — they indicate the application or OS cannot consume data fast enough — and are often misdiagnosed as network issues. PcapAI automatically distinguishes Zero Window slowdowns from genuine network packet loss.
What is the difference between a TCP retransmission and a spurious retransmission?
A standard TCP retransmission occurs when the sender doesn't receive an acknowledgment within the timeout window and resends the packet — indicating genuine packet loss. A spurious retransmission occurs when the ACK actually arrived, but the sender's retransmission timer fired too early due to RTT measurement errors or aggressive timeout values. Spurious retransmissions indicate a tuning problem rather than actual packet loss, and confuse standard Wireshark filters that treat both types identically.
How do you calculate packet loss rate from a PCAP file?
Manually calculating packet loss from a PCAP requires counting retransmitted segments per TCP stream, dividing by total segments, and aggregating across all flows — a process that requires scripting or extensive manual work in Wireshark's Statistics menu. PcapAI calculates the global retransmission rate and per-flow packet loss automatically from any PCAP upload, presenting the results as a ranked list of worst-performing connections in seconds.
Related Use Cases
Stop guessing. Start proving.
Upload a capture of your slow application traffic and get a ranked breakdown of every bottleneck in under 60 seconds. No installation. Or view pricing for enterprise team access.
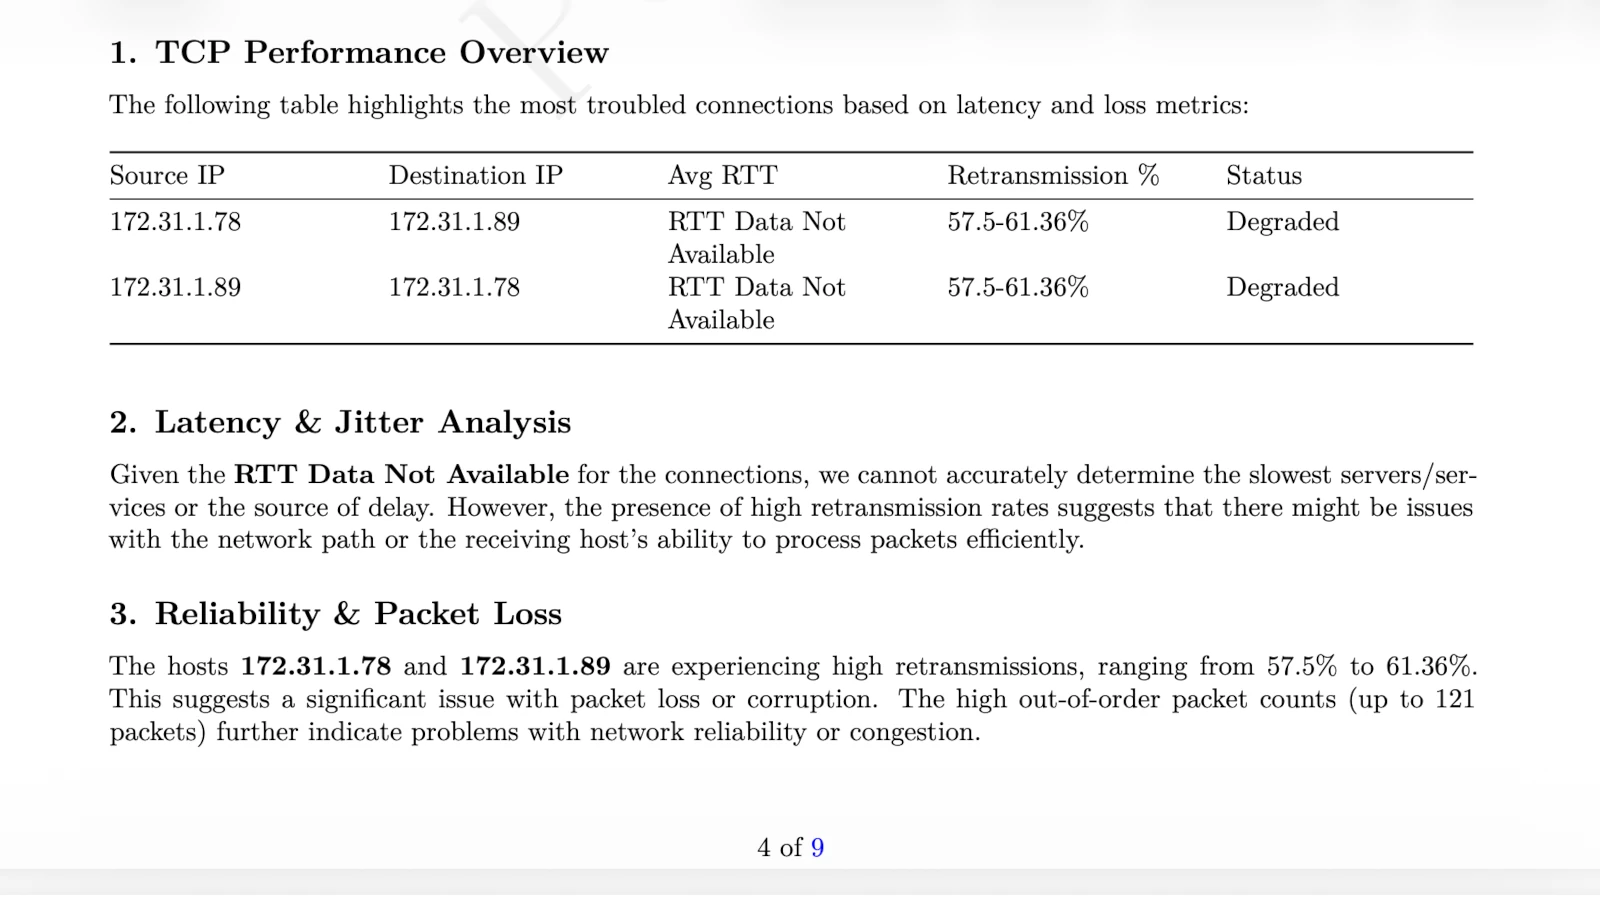
AI Analysis Output (Sample)