
PCAP Analysis Report Example
This is what the $9 PDF looks like. Below are two PCAP analysis report examples, a network troubleshooting report and a security assessment, made from public sample captures by the same engine that analyzes yours.
What Every PcapAI Report Contains
Every report has the same structure, so a client or a manager finds the answer on the first page and an engineer finds the evidence behind it.
-
1
Executive summary
One page: the risk or network impact score, findings by severity, coverage, where the fault lies or the attack path, the activity over time, and the recommended actions with owners.
-
2
Scope, evidence and limitations
The file, its size and SHA-256, the frame count, the capture point, the engine and ruleset versions, and what this capture cannot show.
-
3
Findings, each with evidence
A summary table, then every problem or finding with its severity, confidence, affected hosts, times and measured values. Security findings list the Wireshark frames and a display filter for each observation.
-
4
Remediation roadmap
Steps grouped from “immediately” to “strategic”, each with an owner, the effort, a verification and the findings it closes; troubleshooting steps include the commands to run.
-
5
Coverage: checked and clean
Which areas passed, which were assessed only in part, and which the capture could not assess, with the reason.
-
6
Assets, capture quality and the next capture
Hosts with IP, MAC, vendor and role; external destinations; dropped or cut frames; and how to capture better next time. Appendices hold the event log, the methodology and scoring, and a vocabulary.
Troubleshooting
Sample 1: Network Troubleshooting Report
app-server-retransmissions.pcap:
18 seconds and 1,900 frames of transfers from an application server that kept stalling.
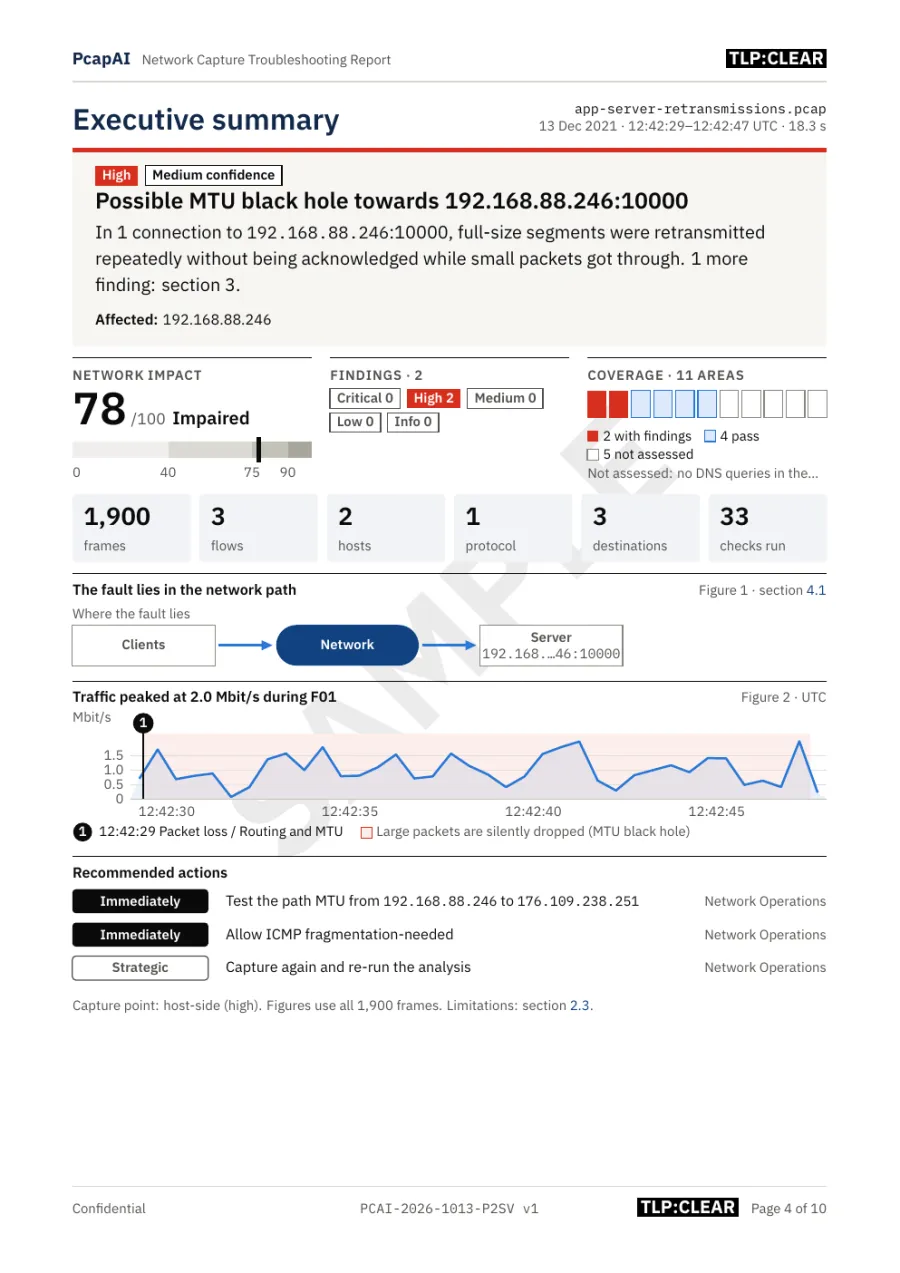
- Network impact 78/100, Impaired: the fault lies in the network path.
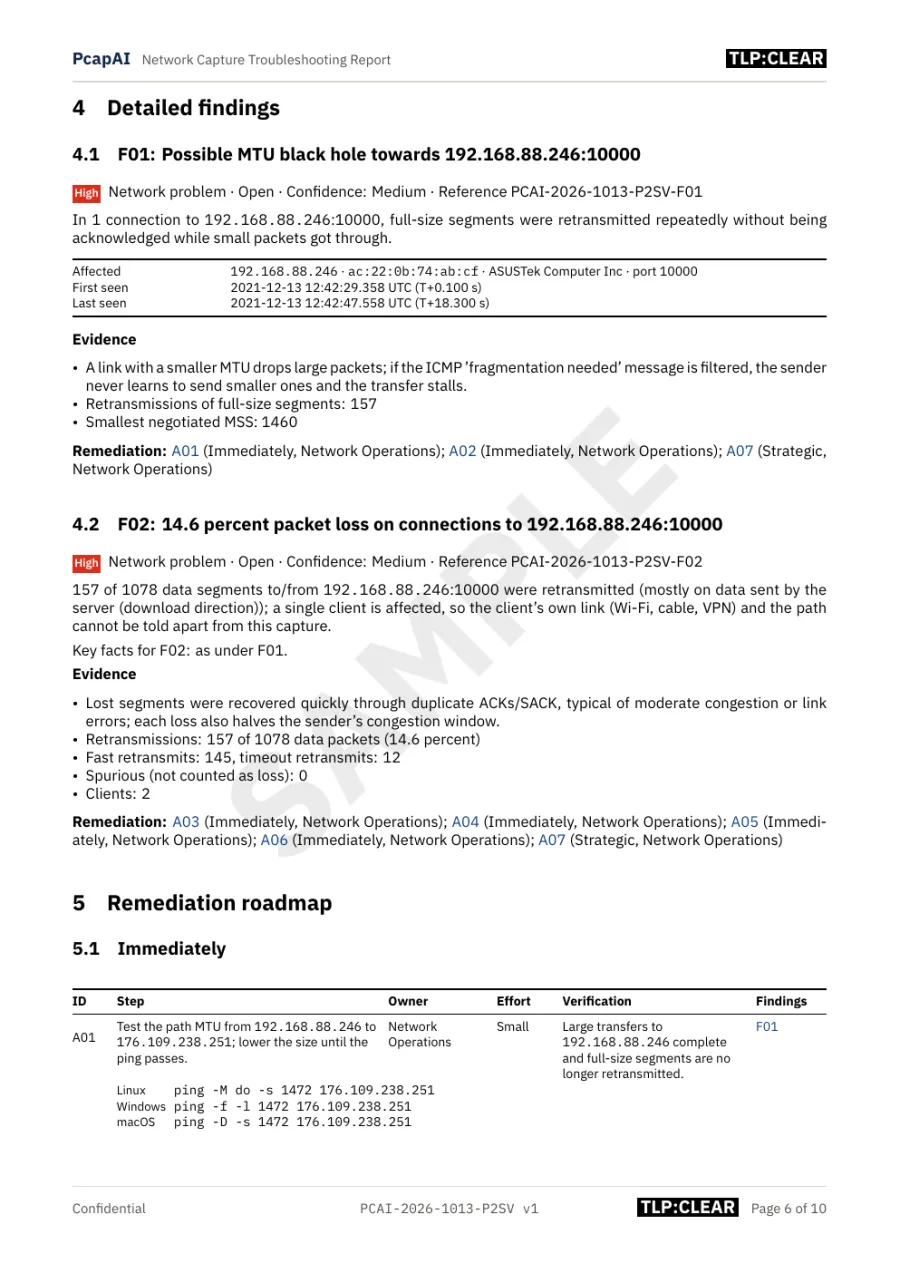
- F01, possible MTU black hole: full-size segments to 192.168.88.246:10000 retransmitted again and again while small packets got through.
- F02, 14.6% packet loss: 157 of 1,078 data segments retransmitted, mostly on data the server sent.
- Fix steps with commands: test the path MTU with
ping -M do -s 1472, allow ICMP fragmentation-needed or clamp the TCP MSS, then capture again.
Download the full PDF (10 pages) · How to diagnose TCP storms and packet loss
Security
Sample 2: Security Assessment (ARP Spoofing)
arppoison.pcapng:
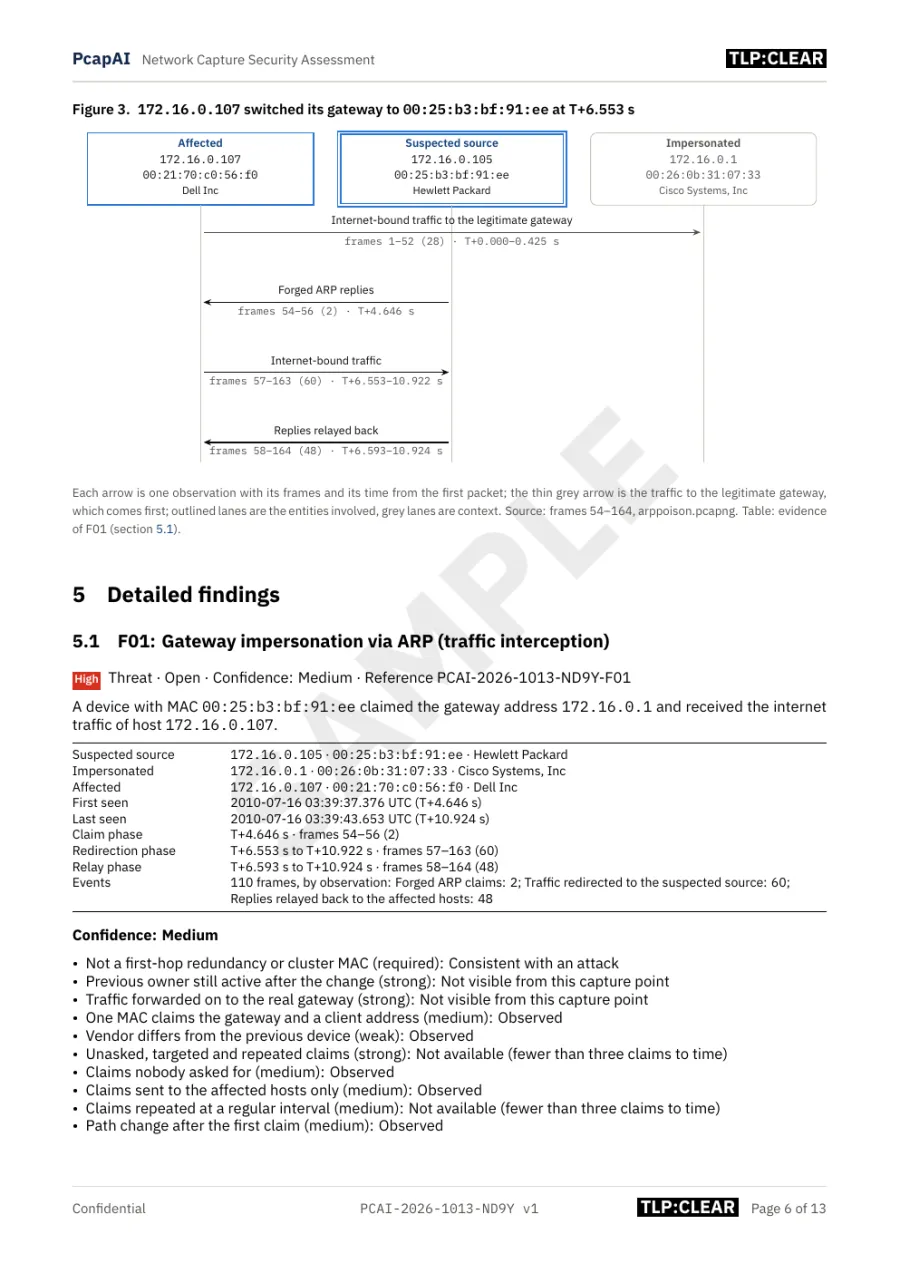
14 seconds and 165 frames from a network where one host’s traffic took a detour.
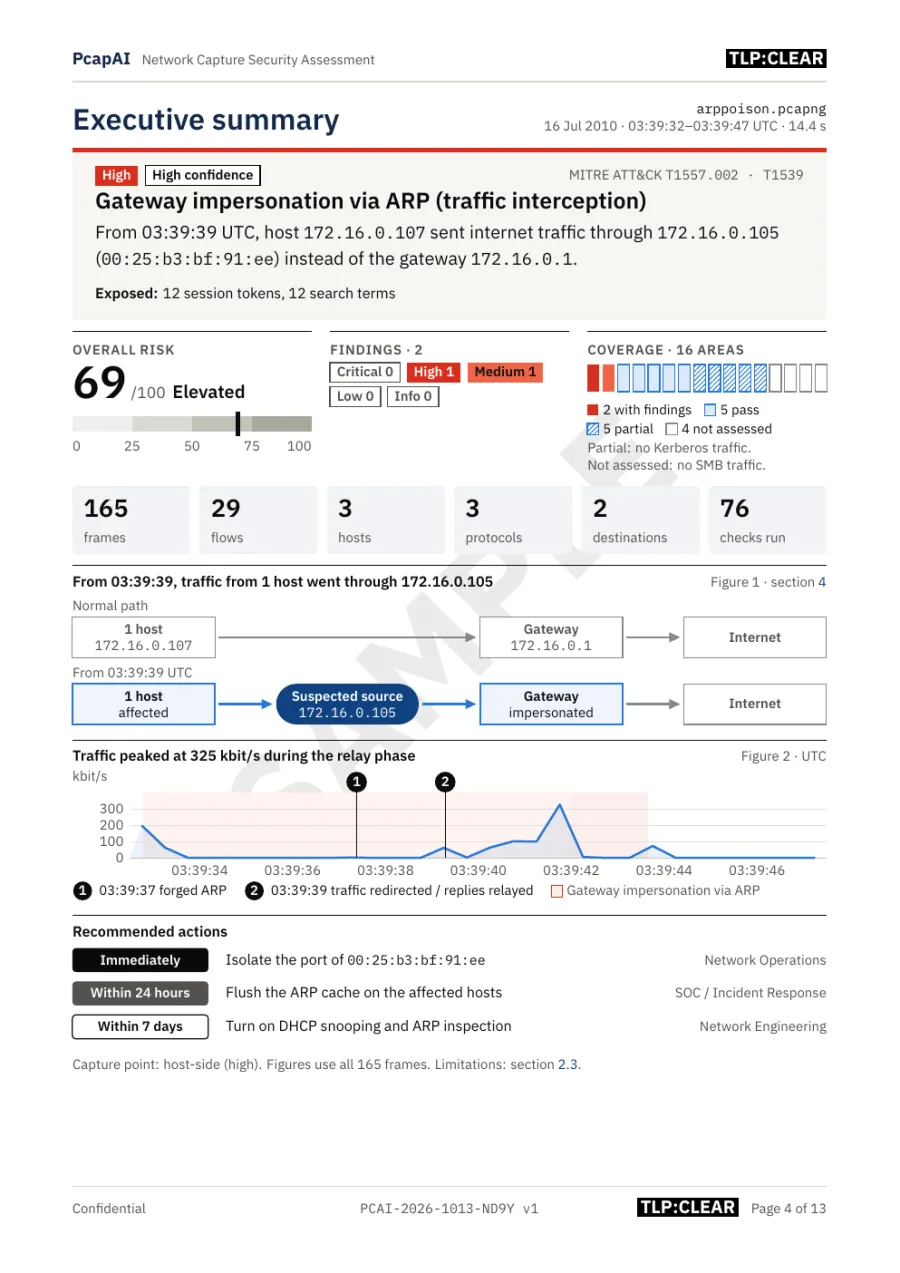
- Risk 69/100, Elevated: 2 findings from 76 checks across 16 areas.
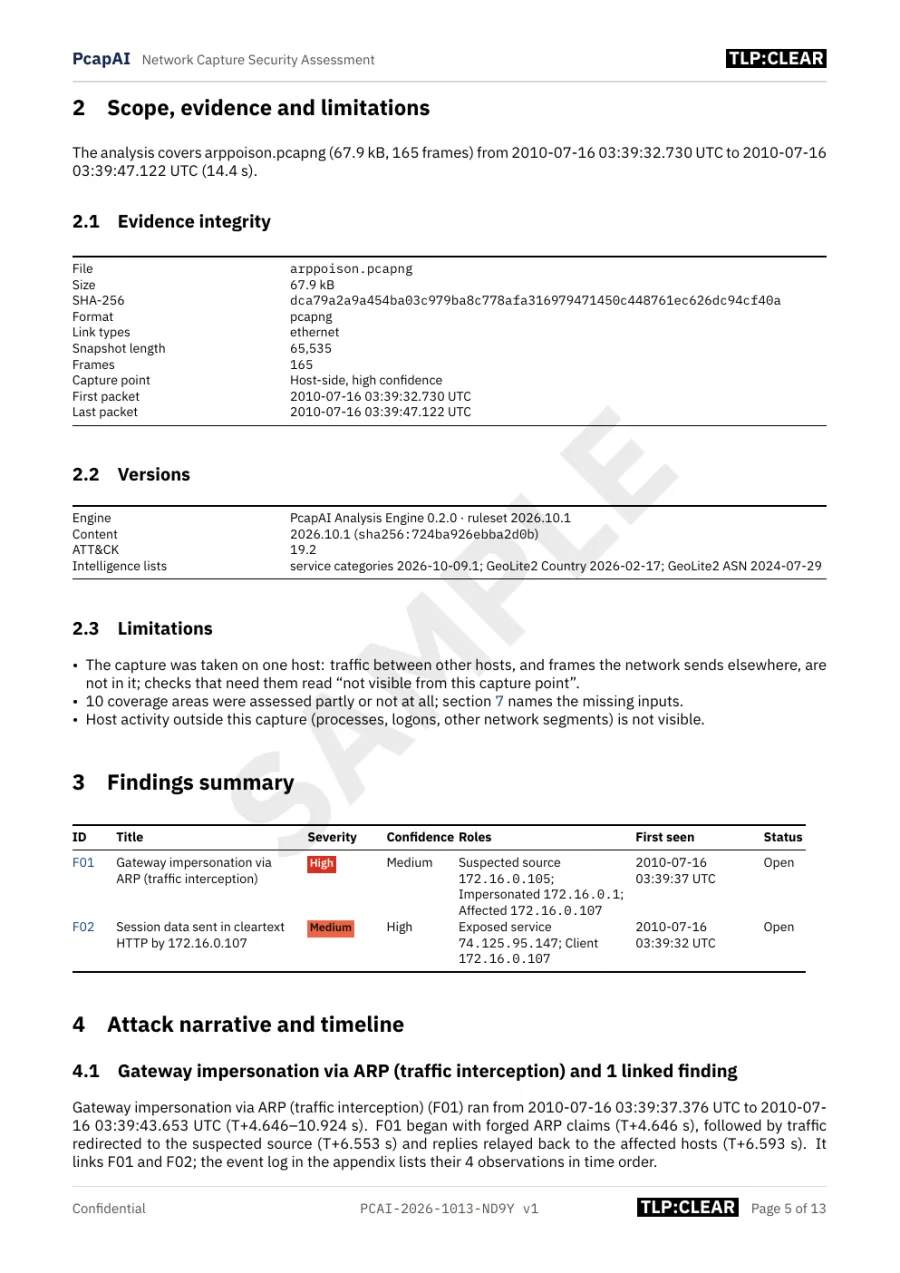
- F01, gateway impersonation via ARP (T1557.002): 172.16.0.105 (00:25:b3:bf:91:ee) claimed the gateway 172.16.0.1 and received the internet traffic of 172.16.0.107.
- F02, session data in cleartext HTTP (T1539): 12 session tokens and 12 search terms readable on the interception path.
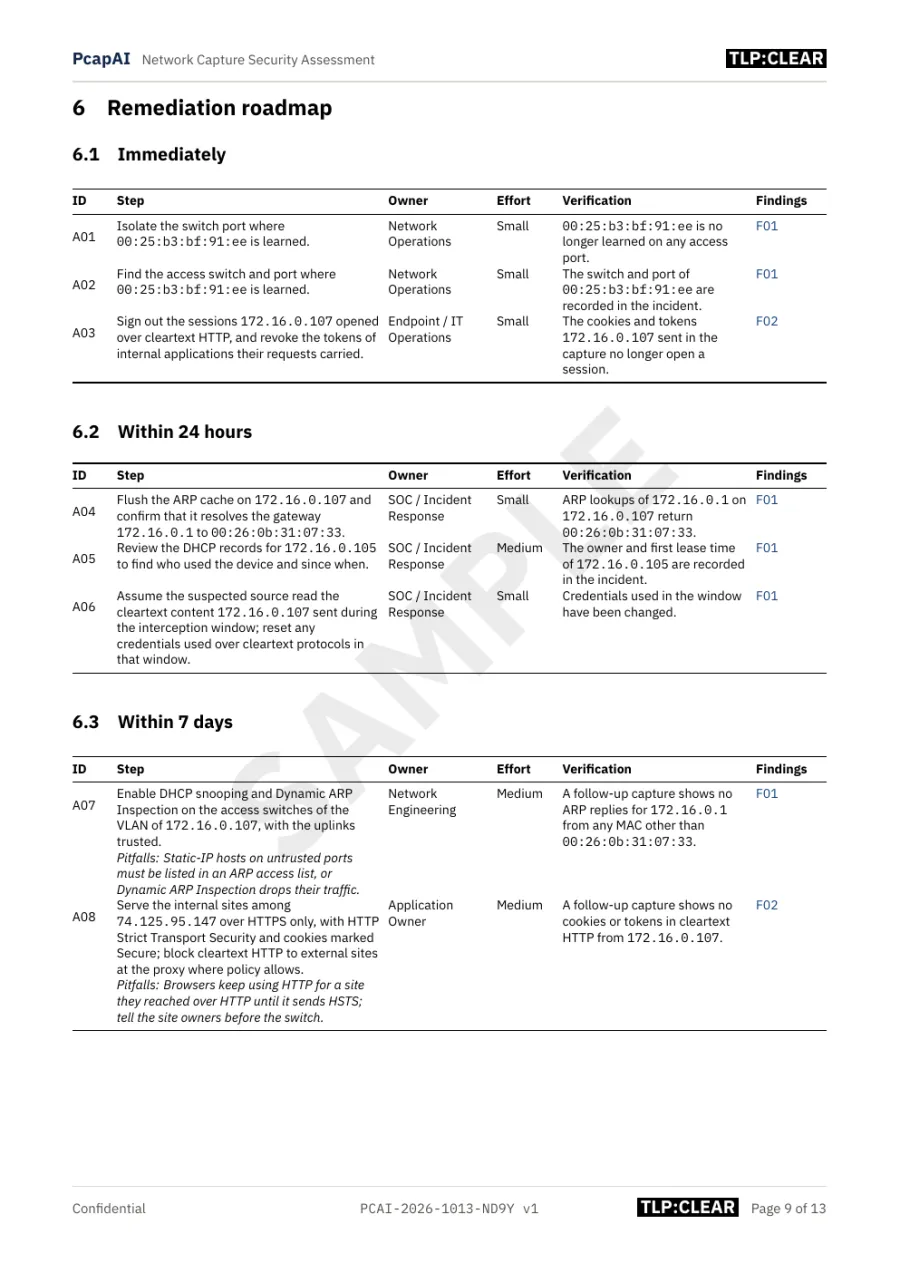
- Actions with deadlines: isolate the switch port immediately, flush ARP caches within 24 hours, turn on DHCP snooping and ARP inspection within 7 days.
Download the full PDF (13 pages) · How to detect ARP spoofing
More Sample Reports
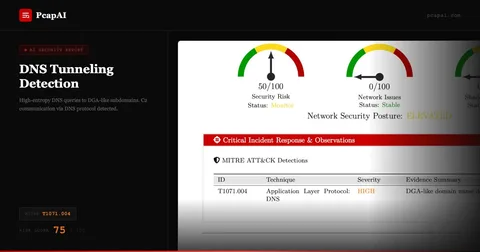
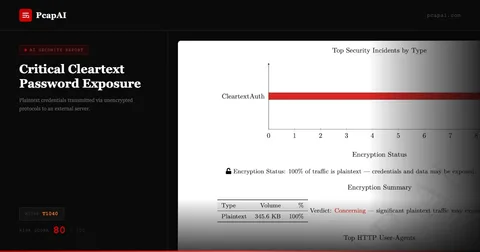
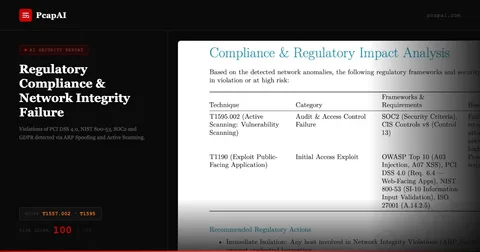
DNS tunneling, cleartext passwords and a PCI DSS and NIST controls review, each with its PDF on the case page. All PCAP analysis examples.
Who These Reports Are For
MSPs and IT consultants
Send the client a document instead of a Wireshark screenshot: the first page explains the problem in plain words, the rest backs it up. Signed-in accounts can print the client’s organization and a TLP label on every report.
Network engineers and IT admins
Show your ISP, hosting provider or vendor where the loss happens, with the hosts, the times and the measured values, and end the “it’s not our network” loop.
Security teams
Triage a capture in minutes, with MITRE ATT&CK mapping, masked credentials and the frames behind each finding for the incident record.
How to Get This Report for Your Capture
- 1
Upload a
.pcapor.pcapngfile up to 20 MB. No account needed. - 2
Read the free summary in about two minutes: the verdict and the problems or findings by severity.
- 3
Get the PDF for $9, or from $4.50 per report with a pack. Full refund within 7 days.
Sample Report FAQ
Are these sample reports made from real captures?
Yes. They come from public sample captures and were analyzed by the same engine and rendered with the same report template as paid reports. They are marked SAMPLE and TLP:CLEAR.
Can the report show my client's name?
Yes, for signed-in accounts: set the organization in your report settings and it appears on the cover and in the footer. The TLP label, the paper size, and the country and sector that add PCI DSS, NIS2 or HIPAA notes are set there too. Reports bought without an account use TLP:AMBER and no organization.
How long is a report?
It depends on the capture: the two samples on this page have 10 and 13 pages. Every report starts with a one-page executive summary.
What does a clean result look like?
If nothing is found, the free summary says so and lists what was checked. An optional clean-scan PDF for $2 records the asset inventory, the coverage of what was checked and what to capture next.