"The App Is Slow": Network or Server?
A slow application is either waiting on the network or waiting on the server, and a packet capture can tell the two apart. Every TCP connection starts with a handshake whose round-trip time is pure network delay. Every request then waits for its first answer byte, and that wait is the round trip plus the time the server spent working. When the round trip is short and the answer is late, the delay is inside the server, and the network team can prove it.
Without that split, the ticket bounces. The application team says the network is slow, the network team points at the server, and the vendor asks for evidence. Users only notice that pages hang for seconds while other sites on the same connection load at once.
One application is slow for everyone, all day, while web browsing, mail and file transfers feel normal.
Handshakes complete in milliseconds, then each request waits seconds for the first byte of its answer.
What the PcapAI Report Shows
In the sample capture, three office laptops use an ERP web application at erp.example.com and load static files from a
second server on the same internet path. PcapAI reports two problems and places the fault on the server:
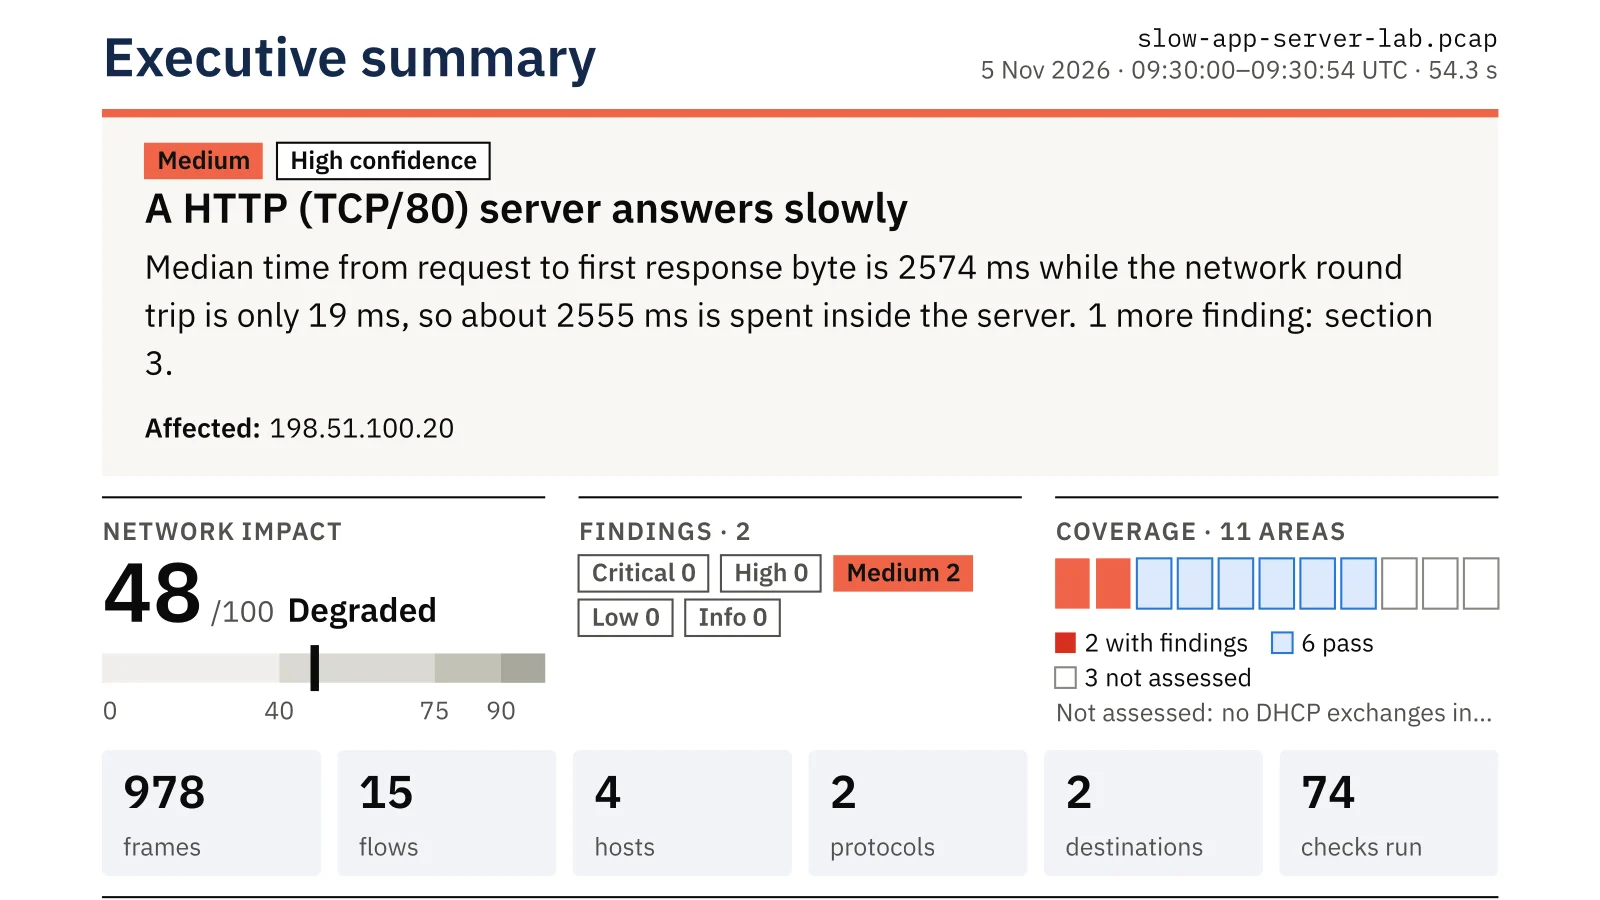
- ✦A server answers slowly: the median time from request to first response byte is 2,574 ms while the network round trip is only 19 ms, so about 2,555 ms is spent inside the server.
- ✦A web server answers slowly: the median time to first byte over 18 HTTP requests is 2,537 ms.
- ✦Everything else is clean: no packet loss, normal round trips, and the static server answers within milliseconds over the same path, which rules out the network.
- ✦Who fixes it: the server or application owner. The report asks them to check CPU, memory, disk I/O and application logs at the capture time, and slow back ends such as the database, authentication or upstream APIs.
The sample capture behind this page was built in a lab: every server uses a documentation address (RFC 5737) and a documentation name (RFC 2606), and the PDF is the unedited report PcapAI wrote for it.
How It Looks in a Capture (Check It Yourself)
In Wireshark, compare the handshake round trip with the HTTP response time of the same server:
tcp.analysis.initial_rtt
http.time > 1
The same split from the command line, one line per HTTP answer (server address and seconds to answer):
tshark -r capture.pcap -Y http.response -T fields -e ip.src -e http.time
When a Slow Answer Becomes a Problem
PcapAI subtracts the round trip from the response time and grades what is left. The limits depend on the type of network:
| Network type | Low | Medium | High |
|---|---|---|---|
| Home, small office, corporate | 500 ms | 1,500 ms | 5,000 ms |
| Data center | 200 ms | 1,000 ms | 3,000 ms |
| Industrial network | 300 ms | 1,000 ms | 3,000 ms |
At least five answers from the same server are needed before it is judged. Remote-shell and remote-desktop ports are left out, because their answers wait for a person.
Common Causes of a Slow Server Answer
- ✦A slow database query, or a lock that requests wait on.
- ✦Too few worker threads or database connections in the application pool, so requests queue.
- ✦A slow dependency: authentication (LDAP, Kerberos), an upstream API or a file share.
- ✦A server short of CPU, memory or disk I/O at busy hours.
The capture cannot see inside the server, so the report hands these checks to the server owner with the times to look at.
From Capture to Fix
- Capture on the client side while a user reproduces the slow step, for a minute or two.
- Upload the capture: the free summary says whether a server answers slowly and how short the network round trip is.
- Send the PDF to the server or application owner. It names the server, the median times and the requests behind them.
- After the fix, confirm from the same client with a read-only check such as
curl -o /dev/null -s -w "%{time_connect} %{time_starttransfer}\n" http://server/path, which prints connect time next to time to first byte. - Capture again: the report's own check is a median response time under 500 ms.
Frequently Asked Questions
How do I prove the network is not the problem?
Show the round trip next to the response time for the same server. The TCP handshake measures the network alone; the time to the first answer byte adds the server's work. A 19 ms round trip with a 2.6 s answer leaves no room for a network fault, and the PcapAI report prints both numbers in one line.
What is time to first byte in a packet capture?
It is the time from the last packet of a request to the first packet of its answer. It includes one network round trip and the time the server needed to start answering, so a long time to first byte on a short round trip points at the server.
Can a slow server look like a network problem?
Yes. Users see the same hanging page either way, and monitoring that only checks reachability shows the server as up. Retransmissions and zero windows can also appear when a busy server falls behind, which is why the report checks packet loss and receive windows separately before it blames either side.
Related Pages
Check your own capture
Capture the slow application traffic and upload it: the free summary shows in about two minutes whether the network or a server is slow, and the $9 PDF adds the servers, the times and the fix for its owner.
Sample Report: Executive Summary